
What percentage of learners in your state have completed a career and academic plan this year?
Can that number be pulled from your statewide CCR system?
Or would someone need to open offline spreadsheets and reconcile slightly different data definitions before the picture becomes clear?
For many states, the answer is somewhere in between. For Kuder partners, that insight is instant.
Across the country, education agencies have made significant progress in collecting and visualizing data. Leaders can often see participation trends, pathway demand, work-based learning engagement, and regional participation patterns through a growing number of dashboards and reports.
That visibility is important. It helps leaders understand how programs are performing and where resources or policy attention may be needed.
But visibility alone does not change outcomes.
The challenge many states are working to solve today is how to move from viewing statewide data to using it to guide action, especially at the district, school, and learner levels, where career readiness takes shape.
A statewide dashboard might show that learner participation is uneven across regions. Leaders may see that certain pathways are growing while others are under-enrolled. Data might reveal that some learner groups are not accessing work-based learning opportunities at the same rates as their peers.
These insights are valuable. They provide the strategic overview state leaders need to guide programs and investments. But those insights become far more powerful when they are connected to the people closest to implementation.
Consider how a single question might move through a connected reporting system:
How many learners across the state have participated in a work-based learning opportunity this year?
At the state level, a leader might begin by reviewing a statewide report showing overall participation rates. The data might reveal that 41% of eligible learners have completed a work-based learning experience. That number helps leaders understand progress toward statewide goals and compare participation across regions.
But the next step is understanding where participation is happening and where it is not.
With a district-level view, state leaders can quickly identify which districts are expanding work-based learning access and which may need additional support. One district may have participation rates above 60%, while another sits closer to 20%. That insight helps the state focus technical assistance, funding, or policy guidance where it can make the greatest difference.
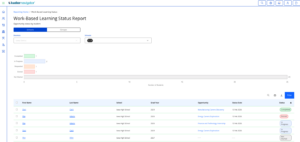
District-Level Status Report
District leaders can then drill one level deeper.
Within a school-level report, administrators might see that some schools have strong employer partnerships and robust internship participation, while others offer only limited work-based learning opportunities. That insight helps district leaders determine whether the challenge is program availability, scheduling barriers, transportation limitations, or learner awareness.
School leaders can take the analysis further.
A principal reviewing school data might discover that participation is high among learners enrolled in certain CTE pathways but much lower among learners in general education programs. That insight may prompt the school to expand employer partnerships or create new opportunities such as job shadowing, career mentorships, or short-term industry experiences.
Finally, counselors and educators can move from insight to action.
At the learner level, they can identify which learners have expressed interest in certain careers but have not yet participated in a work-based learning opportunity. Advisors can reach out to those learners directly, help them explore available experiences, and connect them with local employers or school-supported programs.
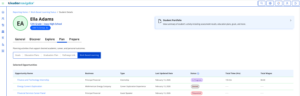
Learner-Level Status Report
What begins as a statewide participation rate ultimately becomes a clear list of learners who could benefit from intentional interventions.
That shift, from static reports to on-demand dashboards with multi-level insight, is one of the most important opportunities in career readiness today. It is also what Kuder is delivering for statewide partners such as those in Oklahoma, Alabama, and beyond.
The states making the greatest progress in career readiness are not simply collecting more data. They are leveraging systems that make that data easier to use.
At Kuder, we believe that is what scalable career readiness infrastructure should do. Technology should help state leaders see the big picture without losing sight of the learner. It should connect planning, advising, and reporting so that insight leads directly to action.
Because ultimately, statewide data is only as valuable as what it helps people do.
The goal is not simply a better dashboard.
It is a stronger decision that helps a learner take the next step toward a meaningful future.
That is the kind of visibility state leaders need, and the kind of system learners deserve.
About Kuder
Kuder, Inc. is a leading career development solutions partner that helps states connect career exploration, academic planning, and workforce pathways at scale. Through integrated technology and data insights customized for our statewide partners, Kuder supports educators and leaders in guiding learners toward meaningful education and career opportunities.
Download the Bridging the Talent Pipeline playbook for deeper insights from our robust reports.
Connect with our team to learn more about how we can partner to support your statewide goals.
The views, opinions, services, and products shared in this post are solely for educational purposes and do not imply agreement or endorsement by Advance CTE, nor discrimination against similar brands, products, or services not mentioned.