Advance CTE’s “Research Round-Up” blog series features summaries of relevant research reports and studies to elevate evidence-backed Career Technical Educational (CTE) policies and practices and topics related to college and career readiness. This month’s blog highlights Career Technical Education and the graduation, college, and employment outcomes for CTE learners with identified disabilities. These findings align with Advance CTE’s vision for the future of CTE where each learner is supported and has the means to succeed in the career preparation ecosystem.
![]() Last spring, the Career and Technical Education Policy Exchange (CTEx) at the Georgia Policy Lab published Graduation, College, and Employment Outcomes for CTE Students with Identified Disabilities. This report examines the relationship between CTE participation and transition outcomes for learners with an identified disorder and for learners receiving special education services for different identified disabilities.
Last spring, the Career and Technical Education Policy Exchange (CTEx) at the Georgia Policy Lab published Graduation, College, and Employment Outcomes for CTE Students with Identified Disabilities. This report examines the relationship between CTE participation and transition outcomes for learners with an identified disorder and for learners receiving special education services for different identified disabilities.
For learners with identified disabilities, participating in career and technical education (CTE) programs in high school appears to positively impact graduation rates and a higher likelihood of securing employment in the year after high school. This report utilizes administrative data from three states, including Massachusetts, Tennessee, and Washington. This analysis is based on data from the 2007-08 through 2015-16 ninth-grade cohort data in Massachusettes, 2009–10 through 2013–14 ninth-grade cohorts in Tennessee, and 2010–11 through 2015–16 ninth-grade cohorts in Washington. This decision was made to address the different learner population sizes; some categories (e.g., specific disability categories) were relatively small within a single high school cohort
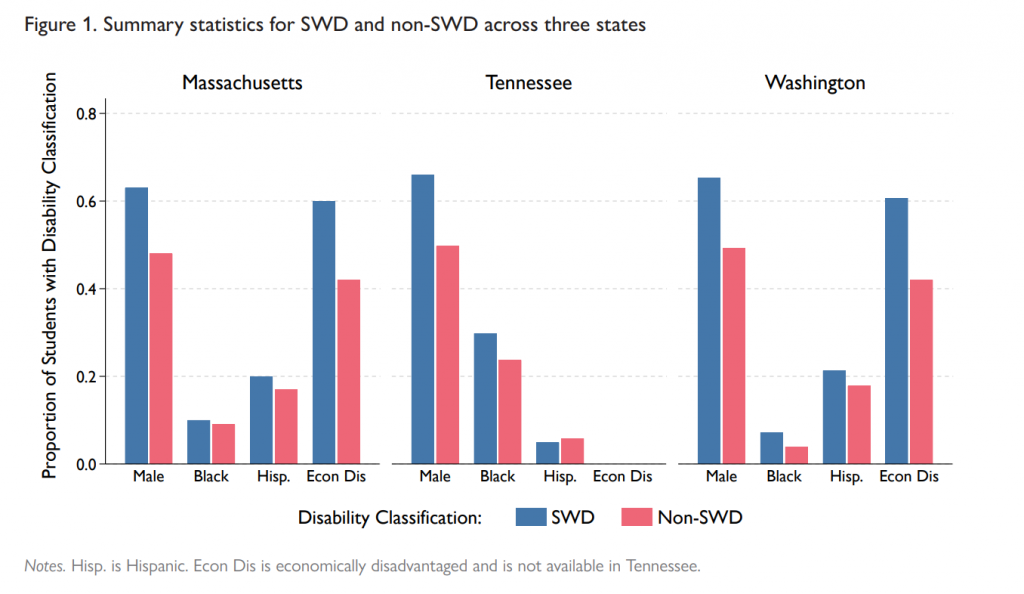
Graph: The chart below offers summary statistics for the population of interest across the three states. The blue bar signifies learners with an identified disorder, and the red bar signifies learners without an identified disorder
The authors examined how CTE concentration for learners with an identified disorder relates to three outcomes:
High school graduation rate within five years of their first year of ninth grade.
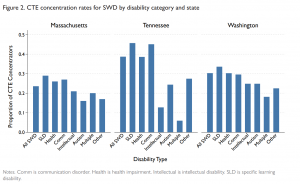
- CTE concentration rates for learners with an identified disorder vary across states and disorder types. Concentration rates for learners with specific learning disabilities, communication disorders, or health disorders are relatively high in all three states.
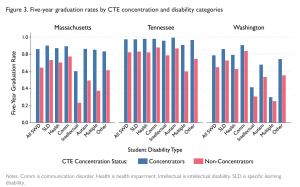
- Across all three states and different identified disabilities, learners with an identified disorder who concentrate in CTE are more likely to graduate from high school than non-concentrators. While not identical, these states have similar concentrator definitions. These differences by CTE concentration status and disorder type vary across the states but tend to be the largest in Massachusetts.
Graph: Five-year graduation rates by CTE concentration and disorder categories
Postsecondary attendance at two-and four-year institutions.
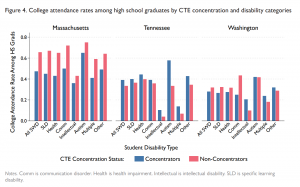
- In Massachusetts, learners with an identified disorder who concentrate in CTE and graduate from high school are less likely to attend college. By contrast, learners with a recognized disorder in Tennessee are more likely to enroll in college if they concentrate in CTE than if they do not. In Washington, the relationship between CTE and college enrollment varies across disorder categories. The gap in college attendance among learners with an identified disorder tends to be smaller between CTE concentrators and non-concentrators in Tennessee and Washington, though in Tennessee, learners with autism who concentrate in CTE are much more likely to attend college than non-concentrators.
Graph: College attendance rates among high school graduates by CTE concentration and disorder categories
Employment rates following graduation.
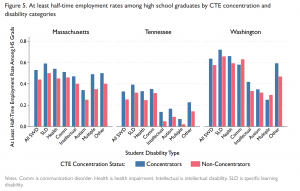
- Learners with an identified disorder who concentrate in CTE and graduate from high school are more likely to be employed at least half-time in the year after graduation than non-concentrators. This pattern is consistent across all identified disorder types in Massachusetts and Tennessee and across most identified disorder types in Washington.
Graph: At least half-time employment rates among high school graduates by CTE concentration and disorder categories.
While the authors noted that their findings were descriptive and may not account for unobserved differences between learners with an identified disorder that are high school CTE concentrators and those with an identified disorder who are not high school CTE concentrators, the results do support existing research trends. Given the differences across states, the authors suggested that state leaders investigate trends in their educational context. Additionally, there may be an opportunity to improve access to these programs for those groups that reported much lower program enrollment rates than learners in other disorder categories.
Suggested follow up reading: Advancing Employment for Secondary Learners with Disabilities through CTE Policy and Practice. This report provides a policy landscape of state-level efforts to support secondary learners with disabilities in CTE programs based on a national survey of State Directors and was produced in partnership with University of Massachusetts Chan Medical School.
To read more of Advance CTE’s “Research Round-Up” blog series featuring summaries of relevant research reports and studies click here.
Amy Hodge, Policy Associate

