One of the smartest investments state policymakers can make is in postsecondary education. As the economy moves towards more specialized, technology-based industries, learners will need education and training beyond high school to fill the jobs of tomorrow. Today, the ticket to the middle class, and the key ingredient for a thriving state economy, is a strong system of higher education.
Yet, this system is not as efficient as it could be. Three out of every four students who enroll in a public, two-year college do not graduate with a degree or certificate within three years. Whether due to financial or family circumstances, lack of clarity about future career goals, or poor academic preparation, too many students are getting saddled with debt and nothing to show for it.
In recent years states have led renewed efforts to improve student outcomes by restructuring postsecondary funding formulas. This approach, known as performance-based or outcomes-based funding, aims to align state dollars with outcomes that support learner success and economic growth, including progress toward and attainment of a postsecondary credential.
As of Fiscal Year 2016, 30 states were either implementing or developing outcomes-based funding formulas for postsecondary education, though two-year institutions were included in the funding formula in only 22 states. While the widespread enthusiasm for accountability and alignment in higher education funding is remarkable, states vary considerably in their degree of commitment. According to HCM strategies, which published a national scan of outcomes-based funding formulas, only four states (OH, NV, ND and TN) in FY2016 distributed more than 20 percent of state funds to postsecondary institutions based on outcomes.
In 2017, the State Higher Education Executive Officers Association (SHEEO) reported that a little more than half of the revenues for postsecondary institutions came from state appropriations (the remaining funding came from local appropriations (6.4 percent) and tuition revenues (43.3 percent)). This gives state policymakers a powerful lever to incentivize change in institutions of higher education.
And, while evidence in support of outcomes-based funding is mixed, positive results have been documented in states with more sophisticated funding systems:
- After enacting a new funding formula in 2014-15, the Wisconsin Technical College System documented a 5 percentage point increase in graduates employed in jobs related to their field of study and a 7 percent increase in the number of degrees awarded.
- In Tennessee, after the state enacted a new funding formula in 2011, researchers noted a significant impact on the likelihood of graduating with an associate degree in three years, completing certifications, and accumulating 12 and 24 credits.
- After the Washington State Board for Community and Technical Colleges enacted the Student Achievement Initiative, researchers documented an increase in the number of short-term certificates issued, though attainment of associate degrees remained flat.
Many states have learned from these lessons and either modified existing or adopted new outcomes-based funding formulas to apply best practices. Arkansas is one such state. In 2016, the state legislature passed HB1209, directing the Higher Education Coordinating Board to design a productivity-based funding formula for state colleges and universities. The formula, which will be used to determine how the Higher Education Coordinating Board distributes general revenue for two-year and four-year institutions, includes three dimensions:
- Effectiveness (weighted at 80 percent): measures credential attainment, progression, transfer and gateway course success.
- Affordability (20 percent): measures time to degree and credits at completion.
- Adjustments and efficiency (+/- 2 percent): includes adjustments for rural schools, research-based institutions, etc.
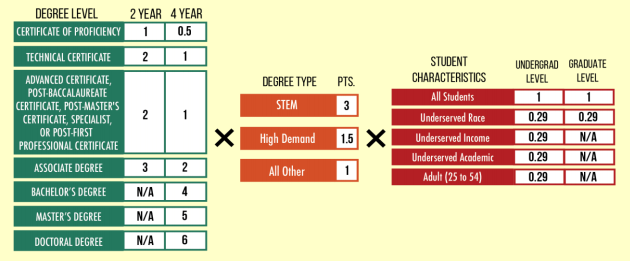
What is notable about Arkansas’ approach is the use of best practices to incentivize credentials with labor market value and encourage equitable access.
 The points an institution receives in the formula for credential attainment are multiplied if the credentials are in Science, Technology, Engineering and Mathematics (STEM) or state-defined “high-demand” fields. Qualifying fields are designated by the the Arkansas Department of Higher Education and the Department of Workforce Services. The multiplier for STEM degrees is 3 points; the multiplier for degrees in high-demand fields is 1.5 points.
The formula also includes adjustments for historically underserved students by race, income, age and academic proficiency. For certain elements of the formula — such as credential attainment or progression — the point value is increase by 29 percent for each student meeting these criteria.
While it is too early to tell the impact of these changes, Arkansas’ productivity index aims to improve postsecondary outcomes by aligning state funding with labor market needs and encouraging institutions to support historically underserved populations.
Austin Estes, Senior Policy Associate
